Home
|
Ocean structure change 1918/1919 at the Fram Strait.
Causation III – Did naval warfare contributed?
Part II on the Start of the Arctic
Warming in Winter 1918/19
By
Arnd Bernaerts, 18 Dec.2010
 Reference:
The previous Arctic warming started in winter 1918/19, in the sea area
between Spitsbergen and Fram Strait. This important fact was established
in a recent paper titled: “The
start of the previous Arctic warming 90 years ago”, while the
discussion of the causation of this event was announced to do in a
subsequent paper. Due to the reasoning of this paper it is Fig.13
regarded as an established fact that the
Arctic winter warming from 1919 to 1940 (EAW)was caused and sustained by
the sea (see: Causation I & II), which does not answer the question of
causation: Was it natural variability, or did human activities contributed?
As neither the reason, nor the mechanism is known, it was suggested to
discuss it separately (Causation III). The following discussion is taking
up the thread and trying to bring
more light into the ultimately most interesting question of the early
Arctic warming (EAW), was an anthropogenic element part of causing the
change
Figure
1 to 12 refer to the previous paper.
Figure 13 to 25 are related to this paper.
Details in the figures in the annex
Introduction:
Analysing the causation of the reasons and mechanism for the EAW faces two
fundamental problems, which the interested reader should be aware of. On
the one hand the awareness of the influence of the ocean on all
atmospheric processes is still in an infancy stage. How many people and
scientists consider weather and climate matter in the relevant dimension
between a sea water and an
air column, which is in cubic-meter 3 to10’000. This means, that one
degree temperature taken from the 3 cbm water volume, the atmosphere above,
over 10 kilometres, can be warmed by one degree. If the air surface layer
over 100 metres has a humidity of 100%, the one degree from the 3 cbm
water-column could inject into the layer the amount of 100 degree. On the
other hand for the Arctic in early 20th Century there a
virtually no direct observation available, very few air temperature data
series, and not any on ocean temperatures, neither from the sea surface,
nor from any lower sea levels.
However,
few, but very important circumstances are established and build the
foundation for the further analysis:
1.
The First World War (WWI) lasted from August 1914 to November 1918.
Since summer 1916 naval war activities and effectiveness increased
significantly due to new weapon systems and mass production.
2.
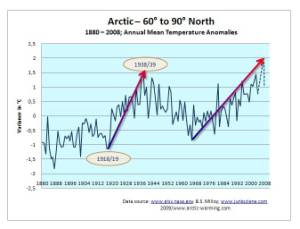
The Arctic temperatures (north of 70°N) between 1915 and 1917/18 were
particularly low ( Fig. 3, 4, and 13). North Europe experienced a very
cold winter 1916/17, which was the third coldest in Great Britain during
the last century.
3.
A highly unusual sea icing in the North Atlantic occurred in summer 1917,
when for the only time in 110 years (1901-2010) the ice covered all sea
area off Spitsbergen in April, extended far south in May and June, and
only retreated in July 1917 (Fig.9-12, and 24).
4.
Record high increase in winter temperature for Spitsbergen in the winter
1918/19, which increased and sustained for two decades. (Fig. 7 and 21)
While the close timing of the four events within a very short time period
is self-evident, it is not immediate obvious that their interdependence is
also very close. From a geographical point of view
it looks as if the
mentioned events, which cover a sea area from the English Channel, along
the Norwegian coast up to the Fram Strait with a bit more than 2000
kilometres (Fig.14), but with the regard to the sea this distance does not
exist. In practical terms of oceanology the distance between Scotland and
Spitsbergen is zero, as by far the most of all sea water which was once
around Great Britain, flows through the front garden in the west of
Spitsbergen, with a small time lag of a couple of weeks or several months.
|

|

|
|
Fig.
14; Major naval battle areas
|
Fig.
15,; U-Boat activity area
|
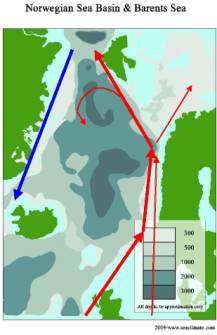
The
initial making of the EAW is not a global issue, and it is neither a North
Atlantic issue, but related to a small corridor in the east of the
northern North Atlantic (Fig.16), which function more like single spot,
rather than a long geographical stretch due to the permanent flow of a
current in only one direction, from south to north, from the UK to the
Arctic Ocean (Fig.8 and 16).
 The
possible nature of causation. Although we have five strongly correlated events it does not
tell very much about the causation, or as presumably required in our case,
about the chain of causation. On the other hand there is no causation
without correlation, and what should not be ignored, that the more strings
and circumstances are pointing into one direction, the more it is
rectified to take any correlation serious. That is what good science
should be all about. Unfortunately earth science is far away from
acknowledging fundamental aspects, which would have made it much easier to
present our case. Although we cannot include them in our reasoning, they
shall at least be mentioned briefly:
Fig.16
- Long term average weather (climate)
is the blue print of the ocean. The influence is a matter of the
conditions of the water column (e.g. heat and salinity), and a time
factor. For a full
investigation of the five events, one would presumably need may
millions along the stretch from the English Channel to the Atlantic
section of the Arctic Ocean. There are extreme few sea surface data
available, and none from lower sea levels.
- Until now science has very
little knowledge of what kind of human activities at sea
(e.g. shipping, fishing, offshore platform) might have an
impact on atmospheric conditions. Even naval war activities, which is
a very sudden, and forceful penetration in the marine environment, has
not reached science.
- Neither can any benefit be
drawn from the fact, that the First World War and the Second World War
(WWII) came up with a number of similar weather pattern in Europe, as
science has done irresponsible little research in this respect. That
becomes evident if one takes note of an observation by A.J. Drummond
at the Kew Observatory (London) published in 1943:
“Since comparable records began in 1871, the only other
three successive winters as snowy as the recent ones
(1939/40, 1940/41, and 1941/42) were those during the last war,
namely 1915/16, 1916/17 and 1917/18, when snow fell on 23%, 48%
and 23%, of the days, respectively”.
If
meteorology and oceanology would have done sufficient observation and
research on each of the three mentioned subjects, the question what
actually caused the EAW would presumably have been answered unison since
long: the ocean and naval war contributed, by a small, medium of big
margin.
A
brief chronology of four years naval war.
Four
years naval war can not be pressed in one brief paragraph. However it
should be recognised that a naval war of the magnitude of WWI, has a much
more serve dimension as other
ocean uses over comparable or even much longer time periods. A
particularly decisive factors is the suddenness, and the intensity over
considerable depths with regard to the temperature, and salinity structure.
This are the two main factors of concern, while any other kind of
pollution is not subject of this analysis, as it is completely out of
reach to quantify and verity its relevance.
August
1914 to Autumn 1916: The first two war years are
presumably completely irrelevant for initiation of the EAW toward the end
of the war. The sea areas affected were the Baltic Sea, the route to
Murmansk, and all waters around Great Britain. What interested
meteorologist could have realised that it was not difficult to observe
that bigger naval encounter immediately
influenced the local weather conditions, by mist, dust, fog, or
rain due to criss-crossing and shelling. For example it happened off the
coast of Scarborough on the 16th of December 1914, and during
the biggest sea battle ever, the Jutland Battle close to the Skagerrak, on
30 May and 01 June 1916, about Winston Churchill brilliantly narrates in
his book “The World Crisis 1911-1918” (p. 251-272, and 599-651).
|

|

|
|
Fig.
17, Sea Mines general situation
in 1918 |
Fig.
18, Sea Mines, “Northern Barrage”, since April 1918
|
Autumn
1916 to November 1918: The
naval war machinery went in full gear since summer 1916, due to new
weaponry and mass production. From
now to the end of 1917 the Allies lost, a ship tonnage of about
7’000’000 tons, which means every month between 70 and 350 ships
(April 1917) that correlates perfectly with the exceptional summer sea
icing in the North Atlantic during the months April to July 1917.
During
the remaining 10 full war months in 1918 the Allies lost another
2’500’000 tons. The total loss of the Allies ship tonnage during WWI
is of about 12,000,000 tons, namely 5,200 vessels. Somewhat five million
tons of cargo and store must have been on board of the sinking ships. The
total loss of all naval vessels (battle ships, cruisers, destroyers,
sub-marines, and other naval ships) amounted to 650, respectively
1,200,000 tons. How many ammunition, shells, torpedoes, and bombs were
used in countless encounters is impossible to verify.
Not
less than 200’000 sea mines were placed, of which about 75’000 had
been used to build the Northern Barrage between Orkney Island and Norway
during summer 1918. Only few months later the temperatures at Spitsbergen
went into a steep rise that became the EAW.
Brief
overview of some sea and weather observation.
As the assumption of a comparability between a number of weather
conditions during WWI and WWII is not yet a settled issue, and it is not
possible to be discussed here, a few aspects shall nevertheless be
mentioned in chronological order. This is merely done to indicated that a
thorough analysis of the entire period could be of considerable help to
understand the reasons of the EAW better.
__(A)
The Arctic temperature record north of 70°North indicate a period
of slightly lower temperature between 1915 and 1918.
(Fig. 2, 3, and 13).
__(B)
The famous icy winter battle in Masuria (north-eastern Poland) in February
1915 between the German Army and the Russian Tenth Army, caused the German
Field Marshall Hindenburg to question: “ Have earthy beings really done
this things or is all but a fable or a phantom”, (citation from: NYT, 07
January 1942)
__(C)
The winter 1916/17 was one of the very cold winters in Northern Europe.
- The German attack on Verdun
started on February 21st 1916 with one million troops; the battle
became the longest of WWI and ended on December 18th 1916. French and
German Army lost several hundred thousand men each. From a climatic
perspective it is to note that close battle field regions had been
wetter than usual, e.g. Baden had been 30% more precipitation, in the
Black Forest rain was even 50-80% higher than normal.
- Along all coastal areas of
Great Britain the winter season 1916/17 (DJF) was the coldest for
about two decades (e.g. Fig. 19), also along the eastern side of the
North Sea up to Norway (Torungen Fry), while the record at
Aberdeen/Scotland and Thorshaven/Faroe Island had similar cold season
only a few years earlier.
|

|

|
|
Fig.
19; Air Temp. (DJF) 1900-1927
Scarborough/UK
|
Fig.20;
Sea Surface Temperature in the English Channel, 1904-1927
|
- For Great Britain it had been
the third coldest winter during the last century (together with war
winter 1939/40). All
three winter months were beneath 2.0C.
- The sea surface temperatures
in the English Channel had been the coldest between 1903 and 1927
(Fig.20).
- On Spitsbergen the months
February, March, April, and May 1917 had been the coldest ever
recorded.
 __(D)
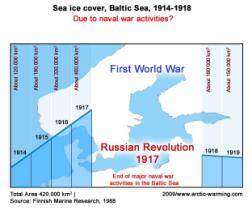
The Baltic Sea sea-ice conditions extended during the war each year until
naval war activities ended with the Russian Revolution in October 1917.
The sea-ice cover during the winter 1917/18 was immediately much less.
(Fig.21)
Fig. 21
__(E) At least one report exist claiming that the sea water at the west
coast of Spitsbergen had shown unusual high temperatures in summer 1918. (Weikmann,
1942)
__(F) During the Spitsbergen winter of 1918/19 the
temperatures varied considerably. There were long periods in November and
December 1918 with temperatures close to zero degrees, 4 days with
temperatures above zero in November and 7 days in December. In January
1919, the temperatures did not reach –5°C for 14 days, and five days
were frost-free.
__(F) The Fisheries Research Service/Aberdeen took sea
surface temperatures in the Scotland - Faroe Channel that show a dramatic
drop from about 1914 to 1920 (Fig. 22), whereby the timing is, based on
the SAT from Thorshaven (Fig. 23), actually from 1914 to 1919 as the air
temperatures level from 1914 is already reach again in 1920 (Fig.23).
|

|

|
|
Fig.
22; SST Scotland- Faroe Channel
|
Fig.23; Air Temp. Thorshaven /
Faroe Is.
|
__(G) The Russian scientist Jules Schokalsky informed
the Royal Scottish Geographical Society in
1935: “The branch of the North Atlantic Current which enters it
by way of the edge of the continental shelf round Spitsbergen has
evidently been increasing in volume, and has introduced a body of warm
water so great, that the surface layer of cold water which was 200 metres
thick in Nansen's time (1895/96), has now been reduced to less than 100
metres in thickness."
This
few mentioned situations should just give an idea that there might be many
hundred, or thousand other suspicious weather or sea observations, which
meteorology should identify and analyse for a fully understanding of the
WWI weather situation.
Causation
III: Which evidence is possible, or sufficient to draw a link to naval
warfare?
As the data required to present a 100% proof are missing to 99,999%,
namely ocean data over considerable time periods, space, and depths in
many millions, while only few air temperature data are available, a full
proof in out of question. Ideally we seek “empirical evidence”, which
is the basic practice of science, which relies on direct experience or
observation in order to describe or explain phenomena.
In a strict sense it requires that observations are being
potentially replicable, which is in our case not an option. On the other
hand we have listed a number of observations and phenomena, which are
closely linked by time, space, and exceptionality, to a strong force,
namely naval warfare, and to one or more effects, e.g., unusual sea and
air temperatures 1917 & 1918, the North Atlantic sea ice in summer
1917 (Fig. 9-12, and 24), and the temperature jump at Spitsbergen during
winter 1918/19 (Fig.25). That is not a proof of a causality, but the
closer, stronger, and comprehensive the observation correlate with each
other, it can reach a stage of a “prima facie evidence”. Prima
facie denotes evidence which – unless rebutted – would be
sufficient to prove a particular proposition or fact.
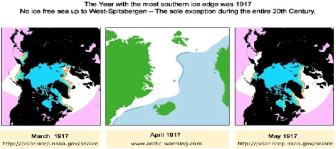 Fig.
24
Our
case is strong in at least two aspects, which can not be rebutted with
reference to “natural variability”, namely:
- The extensive sea icing in the
North Atlantic in summer 1917, that happened only this time during the
last 110 years, and
- The sudden Arctic winter
warming 1918/19 (in the Atlantic section), was presumably the highest
temperatures rise in the Arctic ever recorded.
If
these events were ‘natural’, the claimants of such assertion need to
prove that this happens frequently, and that they are able to compare it
with other observation of a same or similar nature. If they remain silent,
they need to accept that the naval war thesis is a serious option and a
necessity to investigate.
With
regard to the summer sea ice 1917, it is very difficult to name a possible
cause. One can exclude that the icing had been generated from atmospheric
conditions, and if only marginally, as the sea off Spitsbergen was still
ice free in March, which only ended in April at a time the sun has already
influence. Also any assumption that favourable conditions for icing could
have come from the ocean interior seem a too remote possibility.
Considering a link to naval warfare would require to come up with
pollution, in a way that indicates to conditions for favourable icing
conditions, a matter completely out of reach for this paper and my
willingness to investigate this aspect. That is a task of universities and
institutions, and in the responsibility of governmental departments in
charge of climate change matters.
Concerning
the sudden temperature shift in winter 1918/19, my consideration starts
with the observation by Jules Schokalsky, that between about 1895 and 1935
the body of warm water (West Spitsbergen Current) was so great, that the
surface layer of cold water of 200 metres was reduced to less than 100
metres in thickness (see above). This observation leaves two options for
the process that happened over the time span of 40 years:
a)
the decrease of thickness over 100 meter occurred gradually, e.g.
about 2,5 meters per year, or
b)
it happened within a very short time span, with a initial push
during a couple of months prior, and in winter 1918/19, causing a
significant shift that lasted for two decades.
All
circumstance leave little room for not taking the ‘push’ option.
Although
push-option could have started as early as in winter 1916/17, it seems
only remotely possible that any major influence could have been coming
from the low winter air temperatures between Europe and Spitsbergen. The
starting point is more likely the summer sea ice in 1917 (Fig.24), by
setting ocean internal process in motion, which is unfortunately
completely out of reach for any consideration here. But there is at least
the information that the SST at Spitsbergen in summer 1918 had been
unusual high, and the extraordinary low
SST in the Scotland – Faroe Channel (Fig. 22) in the second half of the
1910s, making it virtually impossible to assume ‘natural variability’
by a complete ignorance of the naval war.

In
support of Prima facie it shall be once more repeated what has
already been outlined in the previous paper, that here was nothing in
“the air”, for example a volcanic eruption, or a major earth quake, or
a tsunami, or a meteorite plunging on land or into the sea, which could
have caused the sudden temperature shift in the high North. Instead there
was a devastation war in Europe, and huge naval activities which
penetrated deeply huge sea areas, of which the water masses all ended up
after a short period of time where the shift commenced
Fig. 25
Conclusion
The Arctic warming from 1920-1940 is one of the most puzzling climatic
anomalies of the 20th century, says Bengtsson, et al., 2004,
but fail to explain what was is it all about. Meanwhile, the time
available for science was more than 90 years, but they are not even able
to reckon that the early Arctic warming (EAW) commenced within a very
short period during which a number of strange meteorological observation
could be made, e.g. in Europe (winter temperature), in the North Atlantic
the summer sea ice in 1917, and the temperature shift at Spitsbergen in
winter 1918/19, which is topped by a simultaneously operation of a
disastrous naval warfare in a huge sea area around Great Britain. Due to
the prevailing ocean current system, the assumed cause (naval warfare),
and the observation in the northern North Atlantic and the adjacent Arctic
Ocean sector, the human activities and the significant meteorological
changes occurred, practical at one and the same location.
The
circumstances are so numerous and closely interrelated, and the two major
events in the North Atlantic so exceptional, that it is time that
atmospheric science solves the puzzle, or rebut the prima facie evidence
that the naval war contributed. Regardless whether the role of naval war
during WWI had been only marginal, medium, or considerable, for a science
that talks about the danger of climate change it is irresponsible not to
know precisely, the circumstances of the EAW, and which role did man play,
in the matter to happen, and to stay from winter 1918/19 to winter 1939/40.
Further
Reading:
___Book
(2009)__
“Arctic Heats Up. Spitsbergen
1919 to 1939”; http://www.arctic-heats-up.com
___Paper (2010)__“Indian
Drought and North Atlantic 1917 & 1918” (PDF, 1MB)
___Paper (2009)__ “The
Circumstances of the Arctic Warming in the early 20th Century” (PDF,
0,9MB)
___Home Page___ http://www.arctic-warming.com/
Figures:
__Fig. 13; Redrawing of data from Nasa-Giss & junkscience images.
__Fig.14-17, Various sources, and from the material indicated in Further
Reading.
__Fig.
18; Drawing is based on information from: Daniels, Josephus; (1920);
‘The Northern Barrage’, No.2 (The Northern Barrage and other mining
activities), No.4, The Northern Barrage –Taking up the mines),
Publication, Navy Department,
Washington
Government Printing Office, 1920.
__Fig. 19; Air temperatures Scarborough/UK
data from Nasa-Giss.
__Fig.
20; Based on data from: Lumby, J.K..; (1941); ‘Seasonal changes of water
temperatures with depth’; Quarterly Journal Royal Meteorological
Society, Vol. 67, July 1941,
p. 234-238.
__Fig.21;
Drawing based on data from Finnish Marine Research 1988, at page 91 of the
book “Arctic Heats Up”.
__Fig. 22; Data source: Fisheries Research Service/Aberdeen; And a
redrawing of material at: http://ansatte.hials.no/hy/climate/defaultEng.htm,
Harald Yndestad, Aalesund
university college,
__Fig.23: Based on Nasa-Giss data
__Fig.24; Source as indicated, and at page 91 of the book “Arctic Heats
Up”.
__Fig. 25; based on material by: Hesselberg, Th., Johannessen, T.
Werner; (1958); in: R.C. Sutcliffe, ed.; ‘Polar Atmosphere Symposium –
Part I, Meteorology Section; Symposium at Oslo 2-8 July 1956, London, pp.
18ff; Figure 2.
Schokalsky, J. (1936); ‚Recent Russian researches in
the Arctic Sea and the in mountains of Central Asia’, in: The Scottish Geographical Magazine, Vol. 52, No.2,
March 1936, p. 73-84.
Bengtsson,
Lennart (2004), Vladimir A. Semenov, Ola M. Johannessen, The Early
Twentieth-Century Warming in the Arctic-A Possible Mechanism, Journal
of Climate, October 2004, page 4045-4057.
|
|


